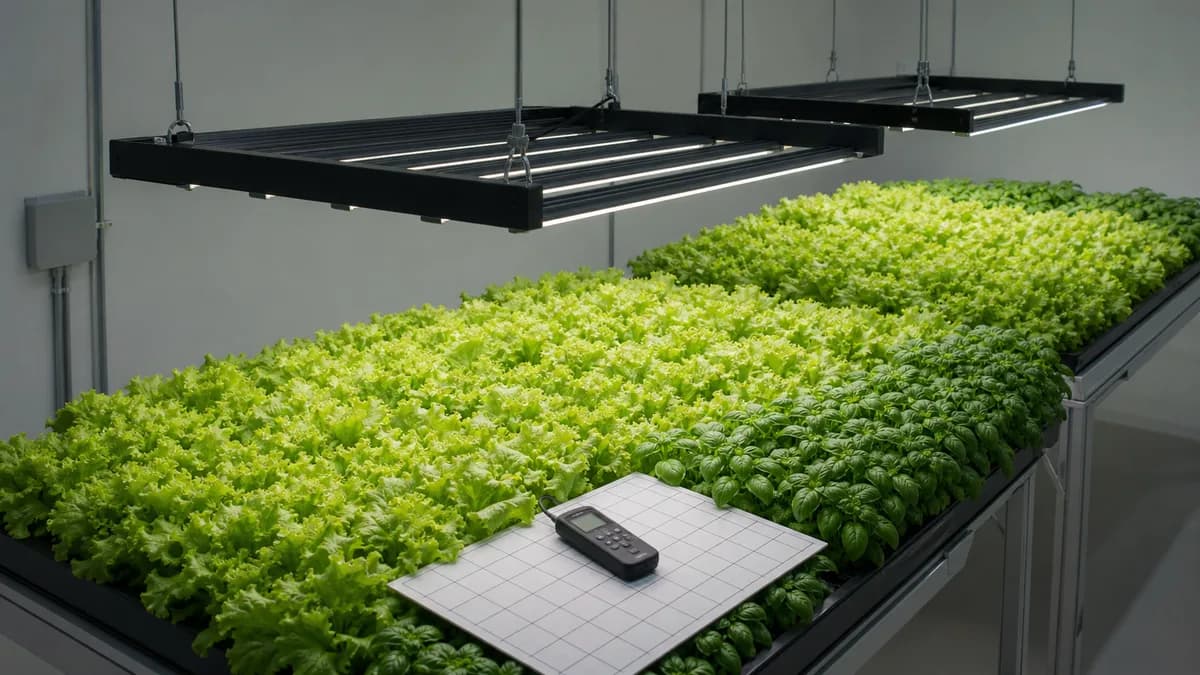
Grow Light Placement and Coverage Guide: Height and PPFD
Plan grow-light count, spacing, coverage overlap, mounting height, and canopy-level PPFD maps without relying on a single center reading.
A grow-light layout must evaluate fixture count, spacing, mounting height, canopy size, coverage overlap, and a canopy-level PPFD map together. A bright center reading cannot show whether edges and corners receive enough light or whether the layout contains hot spots, dim corridors, or poor uniformity.
This guide stays focused on placement and coverage. If you are choosing wavelengths or trying to understand plant responses to light quality, read our LED grow light spectrum science guide. For the room around the lighting plan, use the indoor grow-room layout guide or the greenhouse layout planning guide.
If you want a grow-light planner or visual placement workspace, see the Garden Architect. Use it to organize the layout, then verify coverage with fixture data and a canopy-level PPFD map.
You will use two light measurements throughout the planning process:
- Photosynthetic photon flux density (PPFD) measures the photosynthetic photons arriving at a point on the canopy each second. Its unit is µmol m⁻² s⁻¹.
- Daily light integral (DLI) totals the photosynthetic photons arriving over a day. Its unit is mol m⁻² d⁻¹.
The ANSI/ASABE plant-radiation standard defines these quantities. PPFD describes the map at a given moment. DLI connects that intensity to the hours of light. Electrical watts do not replace either measure because watts describe electrical input, not the photons that reach the plants.
Secondary action for existing users: Open the Garden Architect
Table of contents
- Match fixtures to the canopy area
- Set spacing and coverage overlap
- Grow light coverage overlap
- Read or make a PPFD map
- Choose mounting height
- Check uniformity and edge falloff
Match fixtures to the canopy area
A useful grow-light layout begins with the planted area and a crop-specific PPFD or DLI target. It ends with a measured map. Between those points, you estimate fixture count, place real fixture distributions at a named height, check overlap and boundaries, and revise the design before treating it as a working plan.
Gather the inputs before placing fixtures
Record the width and depth of the planted area, not only the dimensions of the room. A walkway, reservoir, service gap, or unplanted bench section should not receive the same status as the crop canopy. Mark each separate canopy surface if racks or benches sit at different heights.
Next, define the expected top-of-canopy plane. Mounting height means the distance from the light-emitting surface to that plane. A room-height measurement is not enough because the plants will grow toward the fixture. The planned distance should cover the closest expected canopy position, not only the height of new transplants.
Choose a target from a validated plant record or a named crop study. Avoid a generic target for “indoor plants.” Crop, cultivar, growth stage, temperature, and production goal can change the useful DLI or PPFD. Gavhane and colleagues found that different photoperiods at the same PPFD produced different results in one iceberg lettuce system. Walters and colleagues found that herb responses to DLI also changed with crop and mean daily temperature. Ertle and Kubota reported a cultivar-specific trade-off between late-cycle DLI, lettuce tip burn, and yield.
If your source gives DLI and the light will run at a constant output, convert DLI to average PPFD:
average PPFD = target DLI ÷ (light hours × 0.0036)
The reverse calculation is:
DLI = average PPFD × light hours × 0.0036
The constant converts micromoles per second into moles per day. These equations connect PPFD and photoperiod, but they do not prove that any two combinations with the same DLI will produce the same crop. Crop response can also depend on temperature, cultivar, stage, and the timing of the light.
For example, an average PPFD of 240 µmol m⁻² s⁻¹ over a 16-hour photoperiod gives 13.82 mol m⁻² d⁻¹, which rounds to a DLI of 14 mol m⁻² d⁻¹. A value of 300 µmol m⁻² s⁻¹ over the same 16 hours gives 17.28 mol m⁻² d⁻¹, not 15. This is why PPFD, DLI, and photoperiod should be checked as one set before the layout inherits them.
Estimate the fixture count
The fixture data you need is photosynthetic photon flux (PPF), reported in µmol s⁻¹, plus a spatial intensity distribution or canopy map at a stated height. A marketing coverage label without its height, mapped area, and target PPFD does not provide enough information for layout work.
Start by estimating the photon flux that the planted area needs:
received photon flux needed =
target average PPFD × planted area
Then allow for photon utilance, the fraction of emitted fixture photons that reach the target surface:
initial fixture count =
received photon flux needed
÷ (fixture PPF × estimated photon utilance)
Round the result up to a whole fixture. Balasus and colleagues define photon utilance as the received photon flux divided by the emitted photon flux of the lighting system. The calculation is a first estimate based on that relationship and the standardized PPFD and PPF quantities. It is not a photometric layout, and the utilance assumption should stay visible beside the result.
Consider a planted surface of 2 m² with a target average PPFD of 220 µmol m⁻² s⁻¹. The canopy needs 440 µmol s⁻¹ of received photon flux. If each fixture emits 300 µmol s⁻¹ and you assume a photon utilance of 0.70, the estimate is 440 ÷ 210 = 2.10 fixtures, so the first pass uses three. The example does not prove that three fixtures will meet the target at every point. Their distributions could still create a bright center and dim edges.
Turn the estimate into a layout
Place the estimated fixtures over the actual canopy outline. Use the manufacturer's intensity distribution, IES file, or PPFD map for the proposed mounting height when one is available. Keep all fixture models, optics, dimmer settings, and orientations attached to the plan. A map from another model or another height is not interchangeable.
Plan for the full canopy rather than arranging fixture centers into a visually tidy grid. Interior points often receive light from more neighboring fixtures than perimeter points. Harbick and Mattson described this as a bullseye pattern: the middle becomes brighter while the edges and corners remain darker. Their optimized test layout shifted light toward the perimeter and changed fixture height in the center. It used 16 fixtures instead of 20 while raising minimum-to-average uniformity from 79% to 95%. Those values belong to the tested system, but the result shows why measured placement can outperform a regular grid.
Use the first layout to answer four practical questions:
- Does the estimated average PPFD reach the crop target?
- Does the minimum PPFD leave any planted area well below that target?
- Does the maximum PPFD reveal a hot spot that the average hides?
- Are the edges and corners included in the calculation?
If any answer is uncertain, the plan is not finished. Adjust fixture count, position, height, orientation, or dimming, then map it again.
Decision checkpoint: See the Garden Architect to place lights in the wider garden plan. Use the scene to organize fixtures, racks, and planted areas, then confirm coverage with fixture data and canopy measurements.
Set spacing and coverage overlap
Space grow lights by comparing their canopy-level intensity distributions at the planned mounting height. Move adjacent fixtures until their overlap fills the low-PPFD corridor between them without creating an excessive hot band. Include edges and corners, then verify the spacing with a full PPFD map. There is no fixture-independent spacing number.
Start with the beam pattern, not the housing
The distance between fixture housings says little on its own. Two bar fixtures can have different LED pitch, optics, power, length, and intensity distributions. Their useful spacing can therefore differ even when their outer dimensions look similar.
Begin with a cross-section through two neighboring fixture maps. Look at the PPFD directly below each fixture and at the midpoint between them. If the midpoint is much lower than the local target, bring the fixtures closer, raise them to mix their distributions, change their orientation, or select a distribution that suits the area. If the midpoint becomes the brightest band, move the fixtures apart, lower or dim them, or revise the count.
Use the canopy outline as the boundary for the spacing test. The first fixture should not sit half a center-to-center spacing from a wall by habit. It should sit where its real distribution supports the planted edge without sending an unreasonable share of its output beyond the target surface.
Treat height and spacing as one decision
Raising a fixture usually spreads its distribution over more area, but it can also let more photons escape beyond the planted boundary. Lowering it can improve photon capture and intensity, but a fixture with widely spaced LEDs or narrow local beams may show stripes or gaps before those beams mix.
Sheibani and colleagues tested one dense, dimmable fixture at 45, 35, 25, and 15 cm above a lettuce canopy. At a constant PPFD of 160 µmol m⁻² s⁻¹, energy use across the 15-day crop fell from 40 kWh at 45 cm to 20 kWh at 15 cm, with no significant biomass difference in that test. Without dimming, PPFD rose from 160 to 480 µmol m⁻² s⁻¹ as the fixture moved from 45 to 15 cm. An earlier, more sparsely spaced fixture could not be used as close because its beams did not mix evenly.
That study supports close-canopy lighting when the fixture geometry and controls permit it. It does not make 15 cm a general hanging height. A different panel studied by Wong and Zhou became more uniform as distance increased unless reflectors and lenses changed the distribution. The two findings are compatible because fixture pitch, optics, reflectors, dimensions, and height work together.
A spacing workflow you can repeat
- Draw the planted outline and expected canopy height.
- Choose one candidate mounting height within the fixture's documented use conditions.
- Import or measure the fixture distribution at that height.
- Place the first fixtures and inspect the midpoint PPFD between them.
- Add the perimeter and corner points to the same map.
- Move fixtures in small, documented steps.
- Compare minimum, maximum, average, and uniformity after each change.
- Keep the layout that meets the target across the planted area with an acceptable trade-off between fixture count, output, and photon escape.
- Measure the installed arrangement before relying on it.
Do not copy a study's center-to-center spacing as a rule. Gavhane and colleagues used four tubes spaced 15 cm apart in their own vertical hydroponic structure. Zou and colleagues used 12 tubes at 20 cm spacing and then adjusted tube angles based on a PPFD map. Those dimensions describe specific test systems. The repeatable lesson is to map, adjust, and measure.
How-to action: See the Garden Architect to place the candidate fixtures and record their relationship to the planted area. Existing users can then open the setup, but the visual arrangement still needs a canopy-level coverage check.
Grow light coverage overlap
Coverage overlap is the area where light from two or more fixtures reaches the same canopy points. Useful overlap lifts the valleys between fixtures toward the crop target. Poor overlap leaves stripes or dim corridors. Excessive overlap can produce a bright central band while the boundary still receives too little light.
Read overlap as addition across the canopy
At any map point, PPFD is the sum of the contributions that reach it from nearby fixtures. Harbick and Mattson modeled this addition with fixture intensity data at canopy level. Wong and Zhou also summed photon contributions across their mapped target surface. This makes overlap a measurable distribution question rather than a percentage chosen in advance.
Imagine two identical fixture footprints. Directly under each fixture, one footprint may dominate. Near the midpoint, both contribute. At an outer edge, only one fixture may contribute strongly, and part of its distribution may fall outside the planted area. The center can therefore meet or exceed the target while the edge remains dim.
Distinguish four terms in the plan:
- Fixture footprint is the PPFD distribution from one fixture at a named height and setting.
- Coverage overlap is the area where distributions from neighboring fixtures add.
- Edge falloff is the lower PPFD near a boundary because fewer fixtures contribute and some photons leave the planted area.
- Uniformity is a statistic calculated from the full map. It is not a visual judgment based on fixture symmetry.
Correct valleys without building a hot spot
When the map shows a low corridor between fixtures, check whether the cause is center-to-center spacing, mounting height, fixture orientation, or a narrow distribution. Move one variable at a time so you can see which change improved the map.
More fixtures can fill the valley, but count is not the only option. Harbick and Mattson improved their test layout by changing placement and height, with fewer fixtures than the regular layout. Zou and colleagues changed tube angles and repeated their grid measurements. These examples favor measured adjustment over adding fixtures until the average looks high enough.
Dimming can help when the whole central region is high while the perimeter remains near target. If dimming all fixtures also pulls the perimeter below target, change the geometry first. You may need to move outer fixtures toward the boundary, change the central fixture height, use independently controlled zones, or select a distribution better matched to the canopy.
Reflective side surfaces are another possible boundary treatment. In the custom array modeled by Wong and Zhou, side reflectors redirected escaping light and changed both average irradiance and uniformity. Reflectors do not create photons. They redirect some light that would otherwise miss the target. The study's improvement was tied to its reflector, lens, panel, and distance, so it should not be copied as a universal performance gain.
If you add reflective material around a real grow area, keep airflow, humidity, temperature, sanitation, access, and fire safety in the design. Sheibani and colleagues found that reflective curtains did not produce the same crop response under every tested PPFD condition and could obstruct airflow. Treat reflective boundaries as one system variable, not a free fix for poor spacing.
Check overlap at more than one canopy height
A fixture plan can look even at transplant height and become striped as the canopy grows closer. The usable range depends on the fixture's geometry and the crop's expected height.
Map at the closest expected fixture-to-canopy distance before installation if your software or fixture data supports it. After installation, recheck when the canopy height changes enough to alter the distribution. Close-canopy research and short-distance array research both show that the relation between height, pitch, optics, and boundaries controls whether distributions mix evenly.
How-to action: See the Garden Architect to compare candidate fixture positions in the full layout. Mark any planned overlap zones, perimeter corrections, and height assumptions so they can be tested after installation.
Read or make a PPFD map
A PPFD map records light intensity at a regular set of canopy-level points across the planted area. It should include the perimeter and corners, then report minimum, maximum, average, and a named uniformity metric. Use the map to find hot spots and dim zones, adjust the layout, and repeat the measurement.
Build the measurement grid
Set every sensor reading on the same reference plane. For a live crop, that plane is the top of the canopy. For an empty setup, support the sensor at the planned canopy height. Record the vertical distance from the fixture's light-emitting surface to that plane.
Divide the planted area into a regular grid. The grid should be fine enough to reveal changes between fixtures and near boundaries. There is no universal point count because a small panel, a long bar fixture, a room, and a multi-tier rack have different spatial scales.
Research grids show how methods adapt to the system. Zou and colleagues measured 63 points in a nine-by-seven grid, 30 cm below 12 LED tubes. Wong and Zhou measured one 88 cm by 54 cm panel on a 32-by-28 grid at a 15 cm distance. Harbick and Mattson calculated canopy-level points from IES data, then checked the prediction with a quantum sensor. These are study methods, not required templates for every grow room.
Always include:
- The four corners of each planted rectangle
- Points along every planted edge
- Points directly below representative fixtures
- Midpoints between neighboring fixtures
- Any visible seam, stripe, shadow, or change in mounting geometry
Do not remove a low corner because it depresses the average. Edge and corner readings often show the coverage problem that a center reading misses. Harbick and Mattson, Sheibani and colleagues, and Zou and colleagues all reported boundary losses or lower edge values in their respective systems.
Measure under controlled conditions
Use a quantum sensor to collect the canopy-level PPFD readings, as the studies by Gavhane and colleagues, Harbick and Mattson, and Zou and colleagues did. Keep the sensor position and fixture output consistent across the grid so each point belongs to the same map.
Record the fixture model, mounting height, orientation, output setting, grid spacing, date, and canopy condition with the readings. These details let you reproduce the map after changing the layout or canopy height.
If software generates the map from manufacturer data, label it as calculated. An installed map remains necessary because real fixture positions, mounting tolerances, walls, racks, and canopy height may differ from the design. Harbick and Mattson reported that their quantum-sensor readings matched their calculated canopy PPFD within 2 µmol m⁻² s⁻¹, but that agreement followed a specific photometric and measurement workflow.
Calculate the map statistics
Add all grid values and divide by the number of points to find average PPFD. Record the lowest and highest readings separately. Then name the equation used for uniformity.
For a beginner-friendly layout check, use minimum-to-average uniformity:
minimum-to-average uniformity =
minimum PPFD ÷ average PPFD
If the minimum is 170 µmol m⁻² s⁻¹ and the average is 200 µmol m⁻² s⁻¹, minimum-to-average uniformity is 0.85, or 85%. A second layout with the same average could have a minimum of 100 and a maximum of 300. Its average alone would hide both the dim zone and the hot spot.
“Uniformity” is ambiguous without the formula. Harbick and Mattson reported several measures, including minimum-to-average, minimum-to-maximum, average-to-maximum, mean absolute deviation, and standard deviation. Wong and Zhou defined uniformity as minimum divided by average for their work. State the chosen metric every time you compare maps.
Do not apply one pass or fail threshold to every grow. Zou and colleagues required at least 80% minimum-to-average uniformity as an experimental control. Wong and Zhou designed specific arrays for at least 0.70 and reported values above 0.80 in some configurations. Those thresholds belong to the study designs. Your acceptance level should match the crop, fixture, production tolerance, measurement method, and applicable design standard.
Use a map-and-adjust loop
Color can make a map easier to scan, but keep the values visible. A smooth color gradient can hide a narrow low point if the grid is too coarse. Read the numbers first, then use the visualization to locate patterns.
Classify each problem before moving fixtures:
- A central hot spot suggests too much contribution in the interior relative to the boundary.
- A dim corridor suggests inadequate mixing between neighboring distributions.
- A dim perimeter suggests too few contributions at the edge or excess photon escape.
- A striped map can indicate low mounting height for the fixture's LED pitch or orientation.
- One isolated low point may be a shadow, measurement error, or local obstruction and should be remeasured.
Change one variable, repeat the full grid, and compare the statistics under the same conditions. Keep the earlier map. The before-and-after record shows whether the adjustment fixed the weakest area or moved the problem elsewhere.
How-to action: See the Garden Architect to keep the PPFD map tied to the physical arrangement of lights and planted surfaces. The planner organizes the layout; your measured grid decides whether the coverage works.
Choose mounting height
Mounting height changes intensity, beam mixing, photon capture, and edge loss at the same time. A lower fixture can reduce escape and energy use when its distribution stays even, but it can also expose gaps or hot spots. Choose height with the fixture layout, then compare canopy maps at the nearest expected crop distance.
Why closer is not always better
Moving a fixture closer usually increases PPFD at points beneath it when output stays fixed. The effect across the full canopy depends on fixture size, LED pitch, optics, orientation, and boundaries. Extended bars and panels at short distances should not be treated as ideal point sources, so the inverse-square law is not an exact layout rule for every fixture.
The close-canopy lettuce study by Sheibani and colleagues showed the potential benefit. With a dense fixture dimmed to maintain 160 µmol m⁻² s⁻¹, reducing fixture-to-canopy distance from 45 cm to 15 cm halved reported lighting energy use over the 15-day cycle. The same researchers rejected a sparsely spaced first fixture for close use because it did not produce enough beam overlap.
Wong and Zhou reached high uniformity at short distance with a custom combination of LED pitch, lenses, and side reflectors. One design result exceeded 0.80 uniformity when the LED-to-canopy distance was half the tested array pitch. That ratio applies to their panel design. It is not a general mounting formula.
These studies point to a conditional rule: lower the fixture only while the whole planted area remains within the accepted map limits. If the minimum falls, stripes appear, or the maximum rises too far above the target, the fixture is too close for that geometry and output setting.
Why higher is not always more uniform
More distance can help neighboring beams blend, but it can also spread photons past the crop boundary. A map may look smoother while photon utilance falls. Raising the light and increasing power to recover average PPFD can therefore trade spatial mixing for greater escape and energy use.
The canopy outline matters here. A large target area under a broad fixture can capture a different fraction of emitted photons than a narrow bench under the same fixture. Balasus and colleagues showed that photon utilance changes with the effective target area. Sheibani and colleagues observed more photon escape near bench edges at greater separation.
Uniformity should therefore be read beside minimum, maximum, average, and the output required to produce them. A layout with a good ratio but an average below the crop target is still underlit. A layout with a good average but a poor minimum still leaves part of the crop behind. A layout that meets both only at an impractical power setting may need different geometry or a better-matched fixture.
Set the installed height
Use this sequence for the final height decision:
- Define the closest and farthest expected canopy positions.
- Obtain or create fixture distributions at candidate distances within that range.
- Compare average PPFD, minimum PPFD, maximum PPFD, minimum-to-average uniformity, and estimated photon utilance.
- Check the perimeter for photon escape and the interior for hot bands.
- Confirm that the fixture can be dimmed or zoned if the closest canopy position raises PPFD above the plan.
- Choose a mounting system that can hold the intended distance consistently.
- Measure the installed map at canopy level.
- Recheck after meaningful canopy growth or a fixture-position change.
Keep crop response separate from layout performance. In one iceberg lettuce system, Gavhane and colleagues found the highest fresh weight and resource-use efficiency at a DLI of 11.5 mol m⁻² d⁻¹ under 200 µmol m⁻² s⁻¹ for 16 hours. A higher DLI of 14.4 in the same test reduced several growth measures. Zou and colleagues recommended different PPFD levels for two tested lettuce cultivars based on yield and energy trade-offs. These values are examples of cultivar- and system-specific findings, not targets for all lettuce.
Check uniformity and edge falloff
The final check must include the canopy minimum, maximum, and average, plus a named uniformity metric such as minimum PPFD divided by average PPFD. Inspect corners and planted edges separately because those points receive contributions from fewer fixtures and can stay dim while the center meets the target.
The final layout should answer a plain question: can the installed fixtures keep the full planted area within the crop plan from the farthest to the nearest expected canopy position? If not, revise the height, spacing, output zones, fixture choice, or planted boundary and measure again.
Decision action: See the Garden Architect to place the selected lights, record the planned height, and check their fit with racks, benches, and planted zones. Existing users may open the Garden Architect as a secondary step. Keep the PPFD map with the project so the drawing and the measured result stay connected.
Last verified:
Put the guide into practice
Use Truleaf Garden Architect to map the space, equipment, and growing system before you build.